




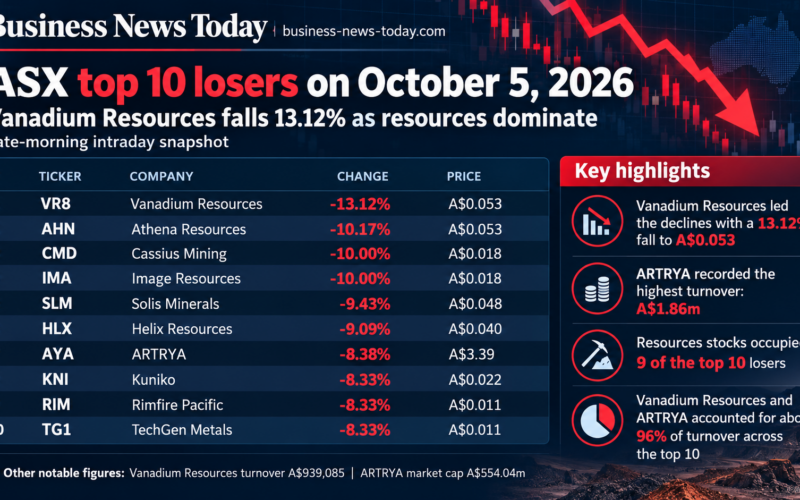
Vanadium Resources Limited (ASX:VR8) was the biggest percentage loser in late-morning Australian Securities Exchange trading on Monday, October 5, 2026, falling 13.12% to A$0.053 as resources companies crowded the downside leaderboard.
Yet the day’s ranking was less broad than the number of red stocks initially suggested. At approximately 11:41 am AEDT, Vanadium Resources had generated about A$939,085 in turnover, while ARTRYA Limited (ASX:AYA), down 8.38% at A$3.39, had traded approximately A$1.86 million. Together, the two companies accounted for about 96% of the roughly A$2.91 million traded across the top 10 losers.
The remaining eight companies generated only about A$107,000 in combined turnover despite declines of between 8.33% and 10.17%. That sharp concentration separates the two most actively traded falls from a cluster of micro-cap declines where relatively limited trading produced much larger percentage moves.
Resources exposure was another defining feature of the session. Vanadium Resources, Athena Resources Limited, Cassius Mining Limited, Image Resources NL, Solis Minerals Limited, Helix Resources Limited, Kuniko Limited, Rimfire Pacific Mining Limited and TechGen Metals Limited occupied nine of the 10 positions, leaving healthcare technology company ARTRYA as the only non-resources name.
Why did Vanadium Resources stand out among the biggest ASX losers?
Vanadium Resources fell 13.12% to A$0.053, making it the largest percentage decliner in the group, but the scale of trading behind the move was equally notable. Turnover of approximately A$939,085 was more than 15 times that recorded by Solis Minerals, the next most actively traded resources company among the top 10.
The company was valued at approximately A$37.15 million at the late-morning price. That placed Vanadium Resources well above several of the micro-cap explorers further down the ranking, while still leaving it small enough for concentrated buying or selling to produce substantial daily moves.
The longer-term performance also complicates the picture. Despite Monday’s decline, Vanadium Resources remained 32.5% higher over one year. The fall was therefore occurring after a period of substantial appreciation rather than simply extending the deep 12-month weakness visible across most of the other resources names.
That contrast matters because identical one-day percentage declines can represent very different market conditions. Vanadium Resources was giving back part of a stronger longer-term move, while several of the companies below it were falling from already depressed levels.
Why did ARTRYA carry more trading weight than its 8.38% decline suggests?
ARTRYA Limited ranked only seventh by percentage decline, but its trading activity made it the most consequential move in the group by value traded.
The healthcare technology company fell 8.38% to A$3.39 on approximately A$1.86 million in turnover, accounting for about 64% of all trading value across the top 10 losers. Its market capitalisation of roughly A$554.04 million also dwarfed every other company in the ranking.
ARTRYA remained 41.25% higher over one year despite the decline. Alongside Vanadium Resources, it was one of only two companies among the top 10 losers still showing a positive 12-month return.
The combination of a relatively large market capitalisation, substantial turnover and positive longer-term performance makes ARTRYA’s fall fundamentally different from an 8% or 10% decline in a micro-cap stock trading only a few thousand Australian dollars. The percentage move was smaller, but the amount of capital involved was substantially greater.
How much of the October 5 decline was driven by thin trading?
Athena Resources Limited illustrated the liquidity issue most clearly. Its shares fell 10.17% to A$0.053, the second-largest percentage decline of the group, but turnover was only about A$1,060.
TechGen Metals Limited fell 8.33% to A$0.011 on approximately A$2,586 in turnover, while Helix Resources Limited lost 9.09% to A$0.040 on about A$3,566. Rimfire Pacific Mining Limited and Kuniko Limited also declined 8.33%, with turnover of approximately A$5,050 and A$7,385 respectively.
Cassius Mining Limited and Image Resources NL each fell 10% to A$0.018. Their turnover of roughly A$10,296 and A$15,825 was higher than some of the smallest names but remained modest compared with Vanadium Resources and ARTRYA.
Solis Minerals Limited occupied the middle ground. The shares fell 9.43% to A$0.048 on approximately A$61,599 in turnover, giving the move noticeably more trading depth than most of the smaller resources declines without approaching the activity seen in Vanadium Resources.
The distinction is important because a leaderboard ranks percentage changes, not the strength or breadth of the trading behind them. On October 5, several visually large losses were attached to relatively little turnover.
What does the one-year performance reveal about the ASX losers?
The 12-month numbers divide the group into two very different categories.
Vanadium Resources and ARTRYA were still higher over one year, with gains of 32.5% and 41.25% respectively. The remaining eight companies were all lower, in several cases dramatically so.
Image Resources NL was down 73.91% over one year, while Kuniko Limited had fallen 72.15% and TechGen Metals Limited 71.05%. Athena Resources was down 62.14%, Cassius Mining 50.71%, Solis Minerals 42.17%, Rimfire Pacific Mining 42.11% and Helix Resources 23.81%.
That makes Monday’s losses more significant for some companies than others. An 8% decline after a strong 12-month advance represents a different price pattern from another 8% decline layered onto a fall of more than 70% over the preceding year.
The broader pattern also suggests that much of the resources-heavy leaderboard was not experiencing a sudden reversal from strength. Several names had already been under sustained pressure long before the October 5 session.
Does nine resources stocks in the top 10 point to a wider sector sell-off?
The dominance of resources stocks is striking, but the turnover data argue against interpreting the ranking as straightforward evidence of broad-based selling across the Australian mining sector.
Nine of the top 10 losers were classified in basic materials, yet trading activity within that group was highly uneven. Vanadium Resources accounted for about A$939,000 of turnover, Solis Minerals roughly A$61,600, while several others traded less than A$10,000.
That concentration matters because small exploration and development companies can move sharply when market depth is limited. A collection of micro-cap miners appearing together among the biggest percentage losers does not necessarily carry the same implication as widespread weakness across larger producers accompanied by heavy trading.
The October 5 moves are therefore better read as a concentrated group of company-level declines within a resources-heavy segment of the market rather than as proof of a uniform sector-wide retreat.
What is the clearest signal from the October 5 ASX losers?
The most useful feature of the day’s trading was the gap between percentage performance and actual participation.
ARTRYA and Vanadium Resources represented approximately A$2.80 million of the A$2.91 million traded across the top 10 losers. The other eight companies combined accounted for only about A$107,000, with Solis Minerals responsible for more than half of that remaining amount.
That means the largest percentage declines were not necessarily the most substantial market events. Athena Resources fell more than ARTRYA, but the difference in turnover was enormous. Several companies losing between 8% and 10% changed hands on only a few thousand Australian dollars.
The one-year returns provide an equally important distinction. ARTRYA and Vanadium Resources were retreating after periods of strong appreciation, whereas most of the other names were adding another weak session to already substantial longer-term declines.
The October 5 leaderboard therefore showed a market divided between two relatively liquid pullbacks and a much broader set of thinly traded small-cap losses. Percentage change identified the most dramatic moves, but turnover and longer-term price direction revealed where the stronger signals actually sat.
Discover more from Business-News-Today.com
Subscribe to get the latest posts sent to your email.
