


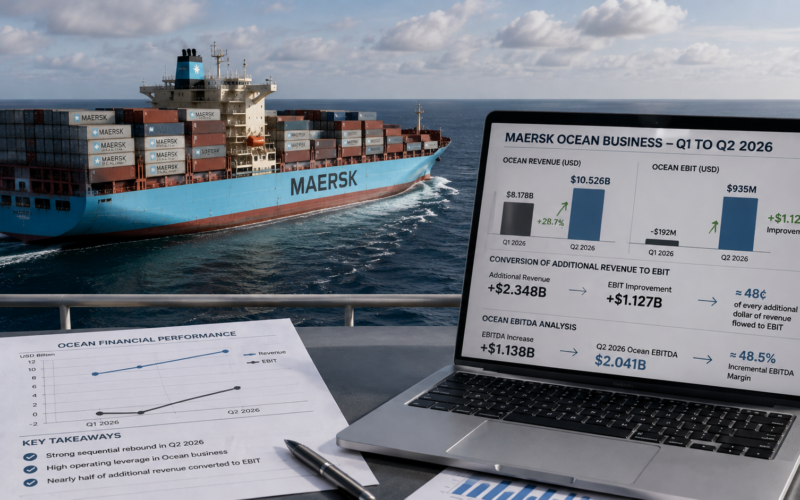
A.P. Moller – Maersk A/S (Nasdaq Copenhagen: MAERSK-B) did more than rebound from a weak first quarter when container freight rates surged in Q2 2026. Its Ocean business generated $10.526 billion of revenue, up from $8.178 billion in Q1, while EBIT swung from a $192 million loss to a $935 million profit. That means an additional $2.348 billion of quarterly Ocean revenue coincided with a $1.127 billion improvement in EBIT.
On a simple sequential calculation, approximately 48 cents of every additional dollar of Ocean revenue flowed through to incremental EBIT. The same calculation at EBITDA level produces almost exactly the same result: Ocean EBITDA increased by $1.138 billion to $2.041 billion, equivalent to an incremental EBITDA margin of about 48.5%.
That is the sharper second angle behind Maersk’s dramatic 2026 guidance upgrade. The original Business News Today story examined whether unusually high freight rates and congestion can sustain the new earnings outlook. The underlying quarter-to-quarter economics show why investors have reacted so strongly: relatively modest changes in container pricing can create disproportionately large changes in profit once vessels are already sailing close to full utilization.
How did $2.35bn of additional Ocean revenue create $1.13bn more EBIT?
Ocean revenue increased 28.7% sequentially between Q1 and Q2, but total operating costs rose by only about 21.2%, from $7.030 billion to $8.522 billion. That gap created substantial operating leverage. The segment’s EBIT margin consequently moved from negative 2.3% in Q1 to positive 8.9% in Q2, an improvement of more than 11 percentage points in only three months.
Freight pricing did most of the heavy lifting. Average loaded freight rates rose from $2,081 per forty-foot-equivalent unit in Q1 to $2,746 in Q2, a sequential increase of roughly 32%. Loaded volumes increased much more modestly, from 3.203 million FFE to 3.361 million FFE, or about 4.9%.
That combination is powerful for a shipping company because the vessel network and much of its cost base are already in place. Once utilization is high, higher rates on existing capacity can produce much faster earnings growth than volume growth alone.

Why did higher fuel costs fail to absorb the freight-rate windfall?
The quarter was not free of cost pressure. Ocean bunker costs jumped from $1.357 billion in Q1 to $2.108 billion in Q2 as average bunker prices increased sharply amid Middle East disruption. Container handling and network expenses also rose as congestion and higher volumes increased operational complexity.
Yet Maersk’s unit cost at fixed energy moved only slightly, from $2,333 per FFE in Q1 to $2,355 in Q2. Q2 unit cost was also 0.8% lower than a year earlier despite total operating costs increasing 19% year over year. Vessel utilization remained at 96%, helping the company spread fixed network costs across a larger cargo base.
The result was that higher freight revenue overwhelmed higher operating expenses. Depreciation and amortization also changed very little sequentially on an implied basis, meaning most of the incremental EBITDA improvement survived through to EBIT rather than disappearing below the EBITDA line.
Does this operating leverage work just as quickly in reverse?
That is the uncomfortable part of the calculation. Maersk estimates that every $100 change in average container freight rates per FFE would affect full-year 2026 EBIT by approximately $700 million, all else being equal. Against the $5.5 billion midpoint of current underlying EBIT guidance, that sensitivity equals almost 13% of expected annual operating profit.
The Q1-to-Q2 swing demonstrates the same phenomenon in real results. Ocean’s freight rate increased by $665 per FFE sequentially, while segment EBIT improved by more than $1.1 billion. The figures cannot be converted directly using Maersk’s annual sensitivity because volume, fuel, congestion, mix and timing also changed, but both measures point in the same direction: freight pricing has enormous earnings leverage.
That makes congestion and Middle East routing unusually important. Conditions that constrain effective shipping capacity can support rates and margins, while normalization through the Suez Canal or easing port bottlenecks could release capacity and reverse part of that benefit.
Why is cash flow still the constraint behind Maersk’s Q2 profit surge?
The income statement improved faster than cash generation during the first half. Maersk produced $4.745 billion of EBITDA and $1.911 billion of EBIT during H1, but free cash flow remained negative $325 million after $1.937 billion of capital expenditure and lease-related cash requirements. Cash conversion was 69%, down from 92% a year earlier.
Q2 itself was considerably better, producing $549 million of free cash flow as operating cash flow reached $2.254 billion. That improvement explains why management upgraded full-year free cash flow guidance from at least negative $1.5 billion to greater than zero.
The next test is therefore whether the extraordinary Ocean operating leverage visible in Q2 can translate into sustained free cash flow while Maersk continues spending heavily on vessels, terminals and logistics infrastructure.
MAERSK-B closed August 14 at a record DKK 20,700, gaining 8.75% during the session and almost 19% across the two trading days following the results. The stock now sits at the top of its 52-week range, showing that sentiment has shifted rapidly toward a stronger shipping-cycle scenario.
The strongest number behind that rally may not be the doubled EBITDA-guidance midpoint. It is the approximately 48% incremental EBIT conversion inside Ocean between Q1 and Q2. Maersk added $2.35 billion of segment revenue and generated $1.13 billion of additional EBIT from it. That is an exceptionally powerful earnings mechanism while freight rates are rising, and precisely the reason investors need to watch rate normalization just as closely as the current profit surge.
Discover more from Business-News-Today.com
Subscribe to get the latest posts sent to your email.