


In a session defined by sharp volatility and risk repricing, the U.S. stock market witnessed broad-based losses on May 27, 2025, with select mid- and large-cap stocks registering double-digit percentage declines. The most significant pullbacks were observed in consumer cyclicals, biotech, Chinese equities, and AI-adjacent names. Institutional sell-offs and stop-loss triggers contributed to the selloff, against a backdrop of hawkish Federal Reserve rhetoric and weakening economic indicators. The top 10 decliners of the day reflected a broad cross-section of sectors, suggesting deeper unease within investor positioning as summer begins.

Why Did Champion Homes (SKY) Stock Fall Over 16% on May 27?
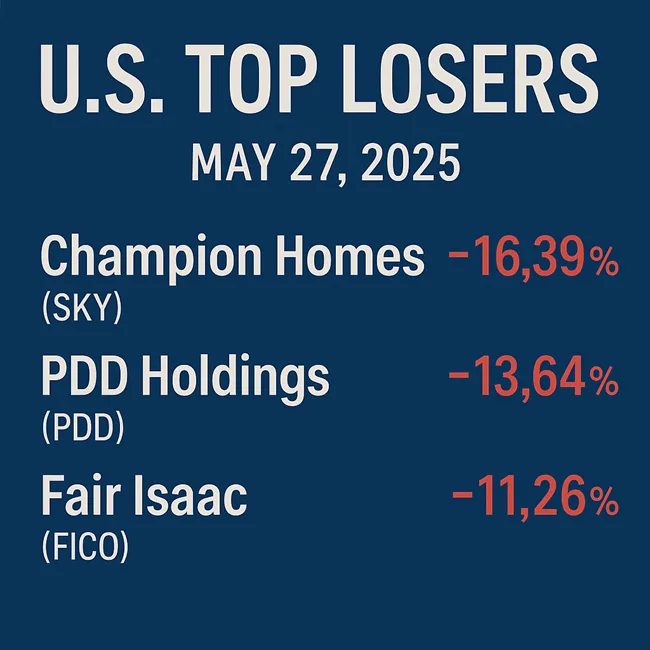
Champion Homes Inc. (NASDAQ: SKY) posted the sharpest decline among U.S. stocks on May 27, 2025, plunging 16.39% to close at $70.45. The sudden drop came despite a strong 19.35% return over the past year, as concerns mounted over softening demand in the U.S. modular housing market. Analysts attributed the sharp correction to disappointing housing starts data and tightening credit availability, both of which affect prefabricated homebuilders disproportionately in a high-interest-rate environment.
Trading volume spiked to 2.78 million shares—well above its 3-month average of 449,000—suggesting institutional liquidation. Valuation had also become stretched, with the P/E ratio at 24.89 ahead of the fall. Portfolio managers appear to be rotating capital into less cyclical real estate segments, such as industrial REITs or infrastructure-linked plays.
What Triggered the 13.64% Decline in PDD Holdings (PDD) Shares?
Shares of PDD Holdings Inc. (NASDAQ: PDD) tumbled 13.64% to $102.98 as investor sentiment on Chinese tech stocks deteriorated sharply. The drop erased $16.26 per share in value and pushed PDD’s 52-week return into negative territory at -20.36%. The rout followed reports that Chinese regulators were scrutinising e-commerce platforms, reigniting fears of a new regulatory cycle reminiscent of 2021’s tech crackdown.
Trading volume surged to over 50 million shares, five times its 3-month average, confirming that institutional investors were scaling back exposure. Despite a relatively low P/E of 11.30, the macro risk premium attached to Chinese assets has widened. Analysts flagged Temu’s razor-thin margins and rising overseas logistics costs as additional stress points that could weigh on medium-term profitability.
Why Did Fair Isaac Corporation (FICO) Stock Lose $190 in a Day?
Fair Isaac Corporation (NYSE: FICO) saw its shares plunge 11.26% to $1,503.62, erasing $190.74 in a single session. The analytics firm, best known for its credit scoring products, had delivered strong financials in recent quarters but was trading at a lofty P/E of 72.99 before the correction.
The stock had rallied more than 22% over the past year, but with investor focus shifting away from premium-multiple software names, FICO became a target for de-risking. The company’s sensitivity to consumer lending trends may also be a factor, as rising delinquencies and plateauing loan originations dampen demand for risk analytics platforms.
Why Is Regencell Bioscience (RGC) Falling After a 11,000% Rally?
Regencell Bioscience Holdings Ltd. (NASDAQ: RGC) dropped 10.42% to $501.62 despite being one of the most explosive stocks over the past year, with a staggering 11,077% gain. The Hong Kong-based biotech firm’s valuation is not tethered to conventional fundamentals, and thin trading volume of just 32,900 shares highlights its illiquidity.
The absence of any major catalyst or company update supports the theory that the sell-off was triggered by profit-taking and technical rebalancing. Analysts remain skeptical of the firm’s long-term value due to its unconventional business model in alternative medicine, coupled with minimal institutional coverage.
Why Did Trump Media & Technology Group (DJT) Drop 10% Again?
Trump Media & Technology Group Corp. (NASDAQ: DJT) fell 10.38% to $23.05, continuing its multi-week downtrend. The stock has now lost 48.49% from its 52-week high, indicating waning enthusiasm among retail traders. Despite the Trump brand and ongoing political relevance under his second presidential term, DJT continues to trade more on sentiment than earnings.
Nearly 50 million shares changed hands—10 times its average—signaling heavy retail churn and algorithmic trading activity. With limited institutional ownership and uncertain monetization pathways, DJT remains a speculative bet. Analysts expect continued volatility leading into the 2025 Republican National Convention.
What Drove Harmony Gold Mining (HMY) Stock Down 8.78%?
Harmony Gold Mining Co. Ltd. (NYSE: HMY) declined 8.78% to $14.45 as gold prices pulled back in response to rising U.S. bond yields and stronger-than-expected economic indicators. While the stock is still up nearly 70% year-on-year, its beta to the gold spot price makes it vulnerable to commodity swings.
Institutional ETF outflows from GLD and GDX over the past week suggest that broader gold exposure was being trimmed. Harmony’s valuation remains reasonable at a P/E of 15.54, but market flows now favor energy and industrial metal producers over traditional gold miners.
Why Did Merus N.V. (MRUS) Shares Drop Nearly 8%?
Merus N.V. (NASDAQ: MRUS) fell 7.87% to $50.80 in a quiet session for biotech, as clinical pipeline concerns lingered ahead of the upcoming ASCO meeting. While no material negative updates were released, the market appears cautious around pre-revenue biotech firms with Phase 1 and 2 assets.
The stock’s low float and sub-$4 billion market cap amplify volatility, and without fresh positive data, risk-averse funds are cycling capital into more mature pharma names. Despite a modest year-to-date gain, MRUS may continue under pressure until new trial milestones are hit.
Why Did TAL Education Group (TAL) See a 7.46% Selloff?
TAL Education Group (NYSE: TAL) declined 7.46% to $10.17 amid renewed speculation around China’s crackdown on for-profit education. Despite efforts to reposition into hybrid tutoring and ed-tech services, TAL’s 78.23 P/E ratio underscores lingering risk.
Mainland media reports suggested new limitations on private tutoring hours, which could curb growth potential. The U.S.-listed education sector remains fraught with regulatory uncertainty, and TAL’s modest 6.23% decline YTD could deepen if the newsflow intensifies.
Why Is Freedom Holding Corp. (FRHC) Falling After a 118% Rally?
Freedom Holding Corp. (NASDAQ: FRHC) saw a 7.33% decline to $156.61 despite being one of the best-performing financial stocks over the past year. The Kazakhstan-based brokerage firm has been under watch for regional exposure to post-Soviet financial institutions and compliance issues tied to cross-border investments.
The company’s market cap of $9.49 billion and P/E of 29.22 suggest robust growth pricing, but geopolitical headlines are driving a cautious approach from global investors. The stock’s daily volume exceeded 285,000—well above average—signaling short-term exits from emerging market-focused portfolios.
What Led to Revolution Medicines (RVMD) Stock Falling 7%?
Revolution Medicines Inc. (NASDAQ: RVMD) dropped 7.03% to $36.97. The precision oncology company remains fundamentally strong with several assets targeting RAS mutations, but traders took profits ahead of key trial updates expected later this summer.
The biotech’s relatively low volatility profile has recently spiked, as broader sector rotation pulled capital toward large-cap names like Amgen and Regeneron. The stock’s modest 4.93% 52-week gain suggests underlying strength, but news-driven swings are likely to dominate until clinical data clarity emerges.
What’s the Market Outlook for These Declining Stocks?
With Federal Reserve policy remaining the central theme in May 2025, investor appetite for high-beta, speculative, and China-exposed equities has declined. Analysts expect market bifurcation to continue, with capital flowing into undervalued industrials, infrastructure, and select energy names. The next round of earnings and macro data could determine whether this week’s pullback becomes a longer-lasting correction.
Discover more from Business-News-Today.com
Subscribe to get the latest posts sent to your email.