


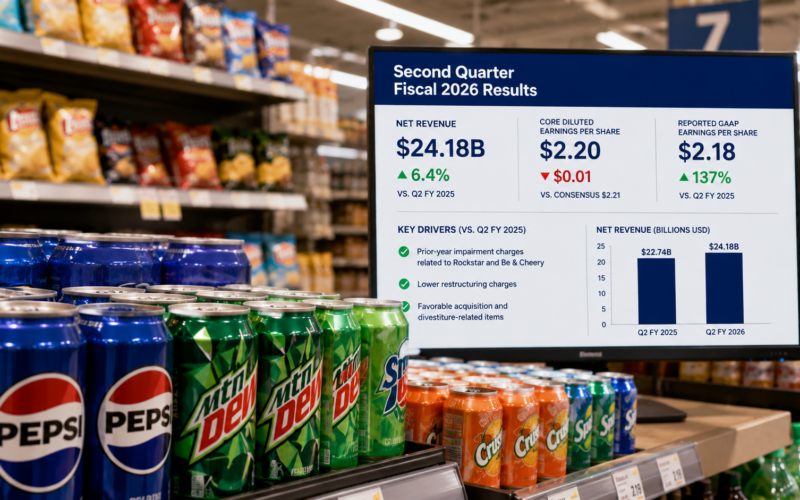
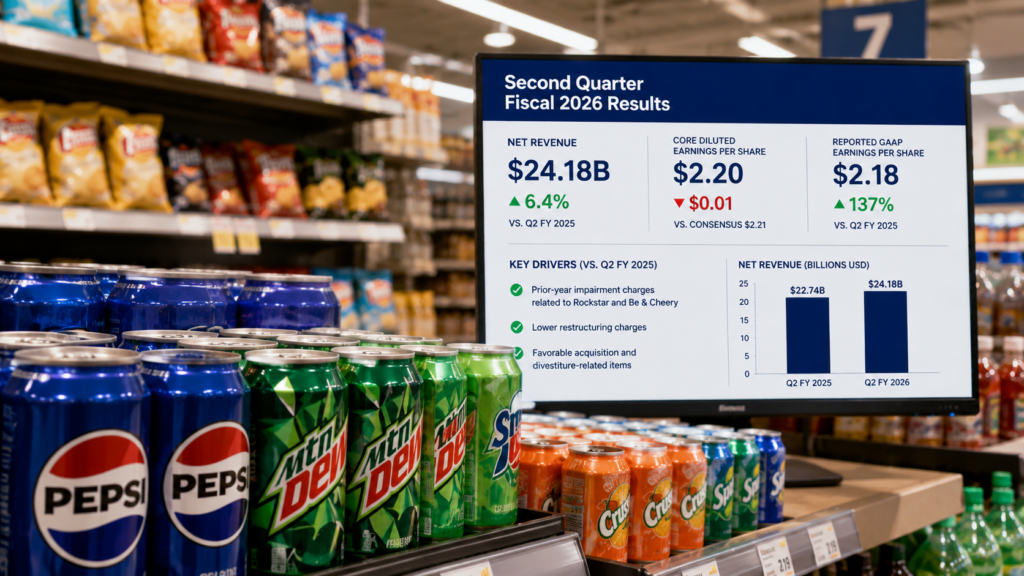
PepsiCo, Inc. (NASDAQ: PEP) reported second-quarter fiscal 2026 net revenue of 24.18 billion dollars, ahead of consensus expectations of 23.96 billion dollars and up 6.4 percent year over year, alongside core diluted earnings per share of 2.20 dollars, one cent below consensus of 2.21 dollars, in a print that combined a modest headline mix of a top-line beat and a narrow bottom-line miss with a materially cautious commentary on the North America trajectory into the second half of fiscal 2026. Reported GAAP earnings per share came in at 2.18 dollars, up 137 percent from 0.92 dollars a year ago, primarily reflecting prior-year impairment charges related to the Rockstar and Be & Cheery brands, lower restructuring charges, and favourable acquisition and divestiture-related items.
PepsiCo, Inc. shares fell 3.19 percent to 137.96 dollars in premarket trading from the previous session close of 142.51 dollars, extending a period of underperformance that has left the equity near the low end of its 52-week range of 132.96 dollars to 171.48 dollars, with the stock down more than 14 percent since mid-April 2026. The Chairman and Chief Executive Officer Ramon Laguarta framed the quarter around the twenty-first consecutive quarter of at least mid-single-digit international organic revenue growth alongside continued momentum from the international scaling agenda, while newly installed Chief Financial Officer Steve Schmitt affirmed full-year fiscal 2026 guidance for organic revenue growth of 2 to 4 percent and core constant currency earnings per share growth of 4 to 6 percent, though he signalled that results may trend toward the lower end of the earnings range with core and core constant currency EPS growth now primarily weighted toward the fourth quarter. The market reaction reflects investor skepticism about the pace of North America stabilisation more than the specific magnitude of the earnings miss, and it puts the third-quarter print into focus as the pivotal read on whether the North America consumer moderation is deepening or stabilising.
What does PepsiCo’s second-quarter 2026 print actually signal about the trajectory of the international business
The international business trajectory is the strongest analytical signal in the second-quarter release. International organic revenue growth accelerated to 7 percent in the quarter, marking the twenty-first consecutive quarter of at least mid-single-digit organic revenue growth for the international portfolio, and each of the four international segments delivered organic revenue growth alongside meaningful core operating margin expansion. International Beverages Franchise revenue grew 11 percent reported and 9 percent organic, with 5 percent volume growth. Europe, Middle East and Africa delivered 10 percent reported revenue growth and 6 percent organic revenue growth. Latin America Foods grew 15 percent reported and 4 percent organic despite an 11 percentage point foreign exchange translation headwind. Asia Pacific Foods delivered 12 percent reported revenue growth and 9 percent organic revenue growth with 10 percent volume growth.
The scale of the international revenue base is now analytically material. International revenue is on pace to exceed 40 billion dollars in fiscal 2026, and approximately 80 percent of that international revenue comes from developing and emerging markets. That composition means PepsiCo, Inc.’s international revenue base is now larger than the aggregate revenue of many mid-cap consumer staples peers, and the emerging market weighting provides both structural growth support and volatility from foreign exchange translation. The 2.2 percentage point tailwind from foreign exchange translation in the second quarter demonstrates the current-cycle benefit, while prior periods have shown how quickly that tailwind can reverse when the United States dollar strengthens.
The commercial architecture underpinning the international performance combines global platform activations with local relevance. The Formula 1 partnership is being extended across more markets, the UEFA Champions League football partnership continues to build, and the Pepsi Football Nation platform ties the brand to fan culture in a coordinated digital and social content strategy. The 2026 FIFA World Cup activations are being deployed with in-market Lay’s flavour innovations and in-stadium execution. Away-from-home concepts including a Lay’s potato-themed restaurant in China, Doritos Loaded expansion across multiple markets, and Tosticentros in Mexico extend brand presence into new consumption occasions. The Sting Energy expansion into Mexico and China opens additional beverage growth vectors, and the Pepsi “House of Treats” platform introduces a crafted beverages proposition designed for away-from-home channels.
Why is the modest core EPS miss on the North America performance more important than the revenue beat suggests
The bottom-line miss reflects a specific mix of dynamics rather than a broad-based fundamental deterioration. Core earnings per share of 2.20 dollars grew 4 percent from 2.12 dollars a year ago, with core constant currency EPS growth of 1 percent, and the miss versus consensus of 2.21 dollars is one cent. However, the underlying North America performance is where the more consequential analytical question sits. PepsiCo Foods North America revenue declined 2 percent in the quarter with organic revenue also down 2 percent, and PepsiCo Beverages North America organic volume declined 4 percent even as reported revenue grew 7 percent aided by a 6 percentage point contribution from acquisitions net of divestitures. North America aggregate organic revenue declined 0.5 percent in the second quarter and trailed management expectations.
The North America core operating margin contraction reflects two distinct pressures. In the convenient foods business, PepsiCo Foods North America is investing in affordability initiatives that are compressing effective net pricing even as volume market share gains are accumulating. The United States salty category has returned to growth for three consecutive quarters with the category outperforming the broader food and beverage category, and PepsiCo Foods North America gained volume share in potato chips, tortilla chips, pretzels, pita and bagel chips, curls and puffs, wavy grain chips, grits, hot cereal, rice snacks, and pancake syrup. However, the affordability investment cost is landing in the profit and loss statement now while the volume and share improvements will take longer to translate into revenue growth.
The PepsiCo Beverages North America performance carries a specific transition drag that will unwind over the coming quarters. The organic volume decline of 4 percent in the second quarter includes a 0.5 percentage point headwind related to the case pack water business transition to a third-party partner. Adjusting for this transition, the underlying beverage volume performance is closer to negative 3.5 percent, which is still weak but reflects consumer budget tightening and category moderation rather than a structural PepsiCo, Inc. issue. The functional hydration platform anchored by Gatorade and Propel, the more than 1 billion dollars Propel franchise gaining share within Enhanced Water, and continued zero sugar and flavoured carbonated soft drink share gains including Pepsi Zero Sugar, Pepsi Wild Cherry & Cream, and Mountain Dew Zero Sugar together demonstrate that the underlying commercial engine remains functional.
How does the Asia Pacific Foods 41 percent core constant currency operating profit growth reshape segment mix
Asia Pacific Foods delivered the standout financial result of the second quarter with 41 percent core constant currency operating profit growth, on 9 percent organic revenue growth and 10 percent volume growth. The magnitude of the operating profit growth reflects both the underlying revenue trajectory and the operating leverage that PepsiCo, Inc. is unlocking as the segment scales in the region. The growth is broad-based, with strong performance across multiple markets including China, Australia, Pakistan, and other Asia Pacific geographies, and it reinforces the case that the segment is transitioning from a smaller growth vector into a materially more important contributor to consolidated operating profit.
The strategic implication of the Asia Pacific Foods growth trajectory extends beyond the specific segment. The 41 percent core constant currency operating profit growth in a single quarter demonstrates the operating leverage that becomes available when regional scale reaches critical mass in emerging markets. If similar operating leverage dynamics can be replicated in Latin America Foods, EMEA, and International Beverages Franchise as those segments continue to scale, the aggregate international core operating margin trajectory should support the medium-term earnings growth thesis even against the current North America pressure.
The consolidation of the international scaling story into the aggregate PepsiCo, Inc. earnings model is where the current equity thesis rests. International core operating margin expanded in the second quarter, and international revenue is on pace to exceed 40 billion dollars in fiscal 2026. If the international portfolio can sustain the 6 to 7 percent organic revenue growth trajectory and continue to expand operating margins, the international contribution to core operating profit becomes progressively larger and the North America volatility becomes progressively less consequential. That composition shift is a genuinely favourable long-term structural story, though it takes time to materialise in the aggregate earnings metrics that drive equity valuation.
Why is the case pack water transition and PBNA volume decline the analytical question ahead of the third quarter
The 4 percent organic volume decline at PepsiCo Beverages North America in the second quarter is the specific number that will drive third-quarter analytical debate. The case pack water business transition to a third-party partner accounts for 0.5 percentage points of the decline, and the underlying beverage volume performance excluding that transition is approximately negative 3.5 percent. Whether that underlying trajectory improves in the third quarter, stabilises at current levels, or deteriorates further will substantially shape the North America earnings trajectory into the fourth quarter and into fiscal 2027.
The commercial factors driving the beverage volume performance combine consumer budget tightening with category-specific dynamics. Consumer budgets are tightening due to rising inflationary pressures, and the trade-down to store brand alternatives that PepsiCo, Inc. saw during 2025 is again visible at retail. Functional hydration is a bright spot with Gatorade and Propel gaining share, and zero sugar variants across carbonated soft drinks are performing well. The Celsius Holdings partnership continues to gain both volume and value share, and Celsius Holdings now holds a nearly 20 percent share of the energy category. However, the aggregate volume trajectory reflects the weight of the base carbonated soft drinks and full-sugar water and sports drinks categories that are decelerating faster than the growth categories are accelerating.
The near-term catalysts that could affect the volume trajectory include the pace of new product distribution expansion, the effectiveness of the affordability investments, and the timing of the away-from-home channel activation. Pepsi Prebiotic, Gatorade Lower Sugar, the newly reformulated Muscle Milk, Starbucks Coffee & Protein, Pure Leaf Mental Focus, Dirty Mountain Dew Cream Soda, and Mountain Dew Baja Cabo Citrus each carry incremental volume potential that will materialise progressively through the third and fourth quarters. Whether the aggregate volume trajectory improves enough to offset the base category deceleration is the operative question that the third-quarter print will answer.
What role does the affirmed fiscal 2026 guidance play against the fourth-quarter earnings weighting the CFO flagged
Management affirmed fiscal 2026 guidance for organic revenue growth of 2 to 4 percent, core constant currency earnings per share growth of 4 to 6 percent, a core annual effective tax rate of approximately 22 percent, capital spending below 5 percent of net revenue, and a free cash flow conversion ratio of at least 80 percent. Total cash returns to shareholders remain guided at approximately 8.9 billion dollars, comprising dividends of 7.9 billion dollars and share repurchases of 1.0 billion dollars. The affirmation is directionally reassuring but the specific commentary that results may trend toward the lower end of the earnings range signals that management is now positioning the market to expect earnings closer to 4 percent core constant currency growth rather than the midpoint of the range.
The fourth-quarter earnings weighting the Chief Financial Officer flagged is analytically consequential. If core and core constant currency EPS growth is now primarily weighted toward the fourth quarter, the third-quarter earnings print will likely show muted year-over-year growth, and the entire full-year earnings trajectory will depend on a strong fourth quarter delivery. That structure creates concentration risk around the fourth-quarter print, and any surprise deterioration in North America consumer trends, incremental input cost inflation, or execution friction on new product distribution would translate directly into full-year guidance downside risk.
The specific inputs into the second-half margin trajectory include record productivity savings, tariff refund claims for tariffs paid in fiscal 2025 that are expected to add approximately 1 full point of EPS growth for the full year, and continued portfolio optimisation. Higher input cost inflation is expected in the second half versus the first half, and the affordability investments in convenient foods will continue to compress effective net pricing at PepsiCo Foods North America. The combination of record productivity, tariff refunds, and moderating consumer inflation into the fourth quarter is the specific set of variables that will determine whether the guidance holds or is revised lower during the third-quarter print or in early fiscal 2027 planning discussions.
How does the international scaling story compete with Coca-Cola, Keurig Dr Pepper, and Monster Beverage
The competitive positioning against The Coca-Cola Company remains the anchor comparison for PepsiCo, Inc. investors. The Coca-Cola Company has outperformed PepsiCo, Inc. by approximately 9 percentage points over the trailing three months and continues to command a valuation premium in the market. The Coca-Cola Company’s more concentrated beverage focus and higher exposure to less discretionary consumption occasions have supported more consistent recent volume performance than PepsiCo, Inc.’s combined convenient foods and beverages portfolio. However, PepsiCo, Inc.’s international scaling agenda and the 41 percent Asia Pacific Foods core constant currency operating profit growth demonstrate that the underlying international expansion capability is delivering, which supports a case for progressive multiple compression relative to The Coca-Cola Company as international scale continues to build.
Keurig Dr Pepper Inc. and Monster Beverage Corporation have both delivered materially stronger three-month share price performance than PepsiCo, Inc., with Keurig Dr Pepper Inc. up 29.6 percent and Monster Beverage Corporation up 31.6 percent over the trailing three months. The Monster Beverage Corporation performance reflects the ongoing energy category strength that has also benefited PepsiCo, Inc. through the Celsius Holdings partnership. The Keurig Dr Pepper Inc. performance reflects the specific commercial success of the Dr Pepper franchise and the coffee portfolio. Both peer comparisons highlight that PepsiCo, Inc. is not being penalised for a broader sector deterioration but rather for company-specific North America execution concerns that the current print does not fully resolve.
The valuation architecture supports the case for a re-rating if execution stabilises. PepsiCo, Inc. trades at a forward price-to-earnings ratio of approximately 16 times against the S&P 500 average of approximately 20.8 times and the consumer staples sector average of approximately 19.3 times. The dividend yield of 4.15 percent supported by 53 consecutive years of dividend increases provides a meaningful total return anchor, and the market capitalisation near 194 billion dollars places PepsiCo, Inc. among the largest consumer staples equities globally. The equity is essentially being valued at a discount to peers because of the current North America execution risk rather than because of a fundamental long-term thesis breakdown, which is a specific market condition that can be resolved by consistent execution rather than requiring a strategic reset.
What are the input cost inflation and tariff refund dynamics that will define H2 2026 margin trajectory
The input cost inflation environment for the second half is expected to be higher than the first half, which is one of the most explicit signals in the CFO’s commentary about margin trajectory. Rising commodity prices for key inputs including corn, wheat, sugar, and packaging materials, alongside continued transportation cost pressure and labour cost inflation, are the specific components that management is monitoring. Geopolitical tensions in the Middle East have driven up certain raw material costs, and PepsiCo, Inc. is navigating the balance between accepting compressed margins or implementing pricing actions that could further pressure consumer volume trends.
The tariff refund dynamic provides a specific offset to the input cost inflation. Refund claims for tariffs paid in fiscal 2025 are expected to add approximately 1 full point of EPS growth for the full year, and record productivity savings should help mitigate the higher input costs. The productivity savings are being driven by the multi-year productivity plan that PepsiCo, Inc. publicly announced in 2019 and has since expanded and extended through the end of 2030. The plan takes advantage of automation, digitalization, and simplification initiatives across the business, with the specific focus on developed markets where operating leverage from productivity is most quickly realised.
The composition of the H2 margin trajectory therefore depends on the interaction between commodity input costs, pricing decisions, productivity delivery, tariff refund timing, and consumer response to affordability initiatives. The record first-half productivity savings position PepsiCo, Inc. reasonably well against the second-half input cost pressure, but the aggregate margin outcome will depend on execution across multiple variables that all move independently. Any single element that underperforms could compress the aggregate margin below the current guidance envelope, while consistent execution across all elements could support margin performance at the midpoint or above of the guidance range.
Key takeaways on what the PepsiCo Q2 print signals for consumer staples investors and packaged foods peers
- PepsiCo, Inc. reported fiscal Q2 2026 net revenue of 24.18 billion dollars, up 6.4 percent year over year and ahead of consensus expectations of 23.96 billion dollars, alongside core diluted earnings per share of 2.20 dollars, one cent below consensus of 2.21 dollars, and reported GAAP EPS of 2.18 dollars up 137 percent primarily due to prior-year impairment charges lapping.
- PepsiCo, Inc. shares fell 3.19 percent in premarket trading to 137.96 dollars from a previous close of 142.51 dollars, extending underperformance that has left the equity near the low end of a 52-week range of 132.96 to 171.48 dollars.
- International organic revenue growth accelerated to 7 percent in the second quarter, marking the twenty-first consecutive quarter of at least mid-single-digit organic revenue growth, with international revenue on pace to exceed 40 billion dollars in fiscal 2026 and approximately 80 percent of international revenue coming from developing and emerging markets.
- Asia Pacific Foods delivered 41 percent core constant currency operating profit growth on 9 percent organic revenue growth and 10 percent volume growth, standing out as the strongest segment performance of the quarter and demonstrating the operating leverage available as regional scale reaches critical mass.
- North America aggregate organic revenue declined 0.5 percent in the second quarter with PepsiCo Foods North America revenue down 2 percent on affordability investments and PepsiCo Beverages North America organic volume down 4 percent, including a 0.5 percentage point drag from the case pack water business transition to a third-party partner.
- Management affirmed fiscal 2026 guidance of 2 to 4 percent organic revenue growth and 4 to 6 percent core constant currency earnings per share growth but indicated results may trend toward the lower end of the earnings range with core EPS growth now primarily weighted toward the fourth quarter.
- Higher input cost inflation is expected in the second half of fiscal 2026, offset by record productivity savings and tariff refund claims for fiscal 2025 tariffs that are expected to add approximately 1 full point of EPS growth for the full year.
- The commercial architecture combines global platform activations including the Formula 1 partnership, UEFA Champions League partnership, Pepsi Football Nation, and 2026 FIFA World Cup activations with local relevance and portfolio innovation including Doritos Protein, SunChips Fiber, PopCorners Protein, Baked with olive oil, Pepsi Prebiotic, Gatorade Lower Sugar, Muscle Milk reformulation, Starbucks Coffee & Protein, Pure Leaf Mental Focus, and Alvalle in the United States.
- Analyst positioning heading into the print reflected caution with sell-side targets recently cut by UBS to 172 dollars, JPMorgan to 170 dollars, Barclays to 144 dollars, Bernstein to 142 dollars, TD Cowen to 150 dollars, and Piper Sandler to 178 dollars, and consensus twelve-month price targets near 163.77 dollars imply approximately 18 percent upside from the pre-market trading level.
- The equity trades at a forward price-to-earnings ratio of approximately 16 times against the S&P 500 average of approximately 20.8 times and delivers a 4.15 percent dividend yield supported by 53 consecutive years of dividend increases, positioning PepsiCo, Inc. as a total return story rather than a pure growth story as the North America execution stabilises.
Discover more from Business-News-Today.com
Subscribe to get the latest posts sent to your email.