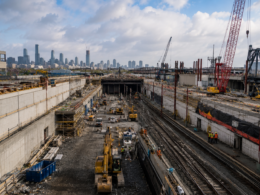



Transurban Group (ASX: TCL), the Melbourne-headquartered toll road developer and operator with major networks in Australia and North America, reported a 3.1% increase in group average daily traffic to approximately 2.58 million trips during the September 2026 quarter. The 21 October trading update showed Sydney traffic rising 3%, Melbourne increasing 4.2%, Brisbane growing 1.1% and North American traffic advancing 4.7%. Strong performance on Sydney’s M7 and the addition of Melbourne’s West Gate Tunnel supported the result, while higher dynamic toll prices contributed to the commercial performance of the company’s United States express lanes. Excluding the West Gate Tunnel, group traffic growth was approximately 1.6%, demonstrating that newly completed infrastructure accounted for a substantial portion of the headline increase.
Why did Transurban’s group traffic increase 3.1% during the September quarter?
Transurban reported higher average daily traffic across all four geographic markets during the quarter. Sydney remained the largest contributor, with approximately 1.077 million average daily trips. Melbourne recorded around 875,000 daily transactions, Brisbane approximately 498,000 and North America about 127,000. The performance reflects both existing road demand and additional capacity introduced through major projects completed over the previous year.
The 3.1% group increase is commercially relevant because toll road revenue generally depends on traffic volumes and the prices charged for journeys. However, the relationship is affected by vehicle classification, toll structures and the ownership interests Transurban holds in individual concessions. A 3.1% increase in average traffic therefore does not automatically establish equivalent revenue or cash flow growth. The September announcement does not provide a complete quarterly revenue statement.
Excluding the contribution of the West Gate Tunnel, group traffic increased approximately 1.6%. This lower figure provides additional context for assessing demand growth across the established network. It suggests that new infrastructure accounted for a significant part of the reported increase. Investors therefore need to distinguish growth created through newly commissioned assets from changes in usage on comparable roads.
The company operates infrastructure with long contractual concession periods, making traffic performance relevant to long-term cash flow forecasts. New roads can increase network capacity and improve connectivity, but initial utilisation may take time to mature. Economic conditions, travel patterns and roadworks can also influence demand. Sustained growth over multiple quarters provides a more reliable indication than one reporting period.
How did the M7-M12 Integration Project increase Sydney traffic by 10.7%?
Sydney average daily traffic increased 3% to approximately 1.077 million trips, supported by strong performance on the M7. Traffic on that motorway increased 10.7% following the opening of the M7-M12 Integration Project. The development improved connections within the western Sydney road network and supports access associated with the new Western Sydney Airport. The increase demonstrates the potential for network upgrades to influence traffic patterns across existing infrastructure.
The M7’s performance is important because greater connectivity can increase the attractiveness of a toll road relative to alternative routes. Drivers may use the motorway more frequently when it provides access to additional destinations or reduces journey times. However, the financial contribution depends on the applicable tolls and the vehicle mix. A higher number of trips may not translate directly into an identical increase in toll revenue.
WestConnex recorded approximately 2.2% traffic growth during the quarter. The network provides major motorway connections across Sydney, serving passenger vehicles and freight movements. Transurban has identified the continued development of connections between roads as an opportunity to support traffic growth. The benefits may be realised progressively as drivers adjust their travel behaviour and surrounding infrastructure develops.
Freight activity also contributed to Sydney’s performance. Truck traffic increased approximately 4.2%, while port container volumes rose around 6.8% year on year. Commercial vehicle movements can be important to toll road economics because trucks often pay different tolls from passenger cars. However, the final revenue contribution depends on the mix of roads and vehicle categories. The results provide evidence of continued freight activity without establishing the precise earnings impact.
Why has Melbourne traffic increased 4.2% when CityLink usage remains broadly flat?
Melbourne average daily traffic increased approximately 4.2% to 875,000 transactions. The result reflects the contribution of the West Gate Tunnel, which opened in December 2025 and averaged approximately 37,000 daily transactions during the September quarter. Excluding the new asset, CityLink traffic declined around 0.2%. This illustrates why the headline Melbourne increase should not be interpreted as equivalent organic growth across the established motorway network.
The West Gate Tunnel was developed to improve freight connectivity and provide an alternative route between Melbourne’s western suburbs, port precinct and central areas. Its commercial performance will depend on how rapidly motorists and freight operators adopt the new route. Initial traffic may develop over several years as surrounding road networks, population patterns and commercial activity change. Early utilisation therefore provides useful evidence without establishing the project’s mature revenue potential.
Transurban has indicated that truck traffic has responded positively to the new route. The tunnel provides an opportunity for freight operators to avoid selected local roads while accessing major transport corridors. Such benefits may support wider economic activity and customer use over time. However, traffic growth can also be affected by competing roads, toll levels and changes in journey requirements.
The company reported that passenger volumes at Melbourne Airport declined approximately 0.5% during the comparable period. Airport-related traffic can influence some motorway journeys, although the relationship varies by corridor. Weakness in that category may partly explain why traffic on existing roads remained relatively flat. The broader Melbourne outlook will depend on population growth, employment patterns and continued adoption of the new tunnel.
How did North American express lane toll prices increase by 20% to 47.4%?
Transurban’s North American average daily traffic increased approximately 4.7% to 127,000 trips. Growth was concentrated on the 495 Express Lanes, where traffic increased 17.3%. The 95 Express Lanes recorded a 3.1% decline, influenced by construction activity on adjacent road infrastructure. These contrasting outcomes show that traffic conditions differ substantially between corridors within the same regional network.
The average dynamic toll price on the 95 Express Lanes increased 20% to approximately US$15.82 per trip. On the 495 Express Lanes, the average dynamic price rose 47.4% to around US$12.36. These increases demonstrate the role of dynamic pricing in managing demand for faster journeys. However, average toll prices can also change with the mix of trips, time of day and traffic conditions.
Dynamic tolling adjusts prices according to road conditions and the objective of maintaining a reliable journey speed. Drivers choose whether the expected travel benefit justifies the price. This creates a commercial model in which revenue can respond to both the volume of traffic and the value customers place on time savings. However, higher prices do not guarantee that every customer will continue using the express lanes.
The 495 network has benefited from infrastructure improvements associated with Project NEXT and other corridor developments. These changes may support continued demand as drivers become familiar with the expanded network. The 95 Express Lanes, meanwhile, face temporary construction-related pressures. The next results will indicate whether traffic returns when those disruptions ease.
How could Victorian toll caps and vehicle classification changes affect Transurban’s financial outlook?
Transurban is monitoring proposals concerning toll affordability in Victoria ahead of the state election. Political parties have outlined policies involving weekly toll caps or other changes to the cost of motorway use. The company has stated that it does not currently expect the announced policies to have a material effect on traffic. However, the commercial and financial outcome will depend on the final policy design and implementation arrangements.
Toll road concession agreements govern pricing and other operating obligations. Changes introduced through government policy can create questions about compensation, contractual responsibilities and the distribution of economic costs. These issues must be assessed according to the applicable legal arrangements. It would be inappropriate to assume that a proposed policy has already changed Transurban’s revenue or contractual entitlements.
The company also disclosed a historical vehicle classification issue affecting CityLink and the West Gate Tunnel. Management does not expect the matter to have a material impact on free cash flow or FY27 distributions. Nevertheless, accurate vehicle classification is important because toll prices can differ between cars, light commercial vehicles and heavy trucks. Reliable tolling systems therefore support both revenue collection and customer confidence.
Policy and operating issues sit alongside wider economic risks. Fuel prices, employment patterns and consumer spending can influence driving activity over time. Transurban’s infrastructure portfolio provides geographic diversification, but each concession remains exposed to local conditions. The company’s financial performance will depend on managing those variations while maintaining network reliability.
What does Transurban’s FY26 performance reveal about its ability to convert traffic growth into cash flow?
Transurban reported that average daily traffic increased 2.2% during FY26, reaching approximately 2.6 million trips. Commercial vehicle traffic increased 6.6% across the group, providing a stronger contribution than the overall traffic figure. The company also reported North American revenue growth of approximately 14% during the year. These figures demonstrate that traffic and pricing can contribute differently to financial performance.
The company has invested heavily in projects intended to improve network capacity and connectivity. Completion of the West Gate Tunnel and M7-M12 integration provides additional opportunities for traffic growth. However, the associated infrastructure requires substantial financing and operating expenditure. Returns will depend on traffic development over the remaining concession periods rather than immediate utilisation alone.
Transurban has also highlighted cost efficiency within its established business. Keeping operating expenditure growth below inflation can help protect margins when toll revenue increases. Nevertheless, debt financing, maintenance and project-related expenditure influence the cash ultimately available for distributions. A complete assessment requires the company’s financial statements rather than traffic volumes alone.
The September results provide encouraging evidence from recently completed infrastructure, particularly in Sydney and Melbourne. They also show that traffic across some established roads remains relatively subdued. Stronger dynamic toll pricing in North America creates another source of potential revenue growth. The company’s next financial results will determine how these developments affect proportional toll revenue, operating cash flow and distributions.
What will determine whether Transurban maintains traffic growth across its four markets?
The immediate operating outlook differs across Transurban’s major regions. Sydney may continue benefiting from improved motorway connectivity, while Melbourne’s West Gate Tunnel remains in the early stages of building its regular customer base. Brisbane is delivering more modest growth, and North America combines strong 495 Express Lanes activity with construction-related pressure on the 95 corridor. These differences make portfolio-wide traffic growth dependent on several distinct factors.
Economic conditions and government policy may also influence traffic volumes. However, established metropolitan road networks can continue serving important travel requirements even when discretionary activity weakens. The financial benefit depends on how those journeys are priced and the cost of operating the assets. The company’s diversified concession portfolio provides exposure to multiple regions without eliminating local risks.
The most useful next evidence will be continued M7 traffic growth, increased utilisation of the West Gate Tunnel and recovery on the 95 Express Lanes. Financial reporting will then show whether those operating trends are converting into stronger earnings and cash generation. The September quarter establishes positive traffic momentum, but the underlying 1.6% increase excluding the new tunnel suggests that growth is not uniform across the portfolio. Sustained returns will depend on the performance of both new developments and established toll roads.
Key takeaways from Transurban’s September 2026 quarterly traffic results
- Group average daily traffic increased 3.1% to approximately 2.58 million trips.
- Traffic growth was approximately 1.6% excluding the West Gate Tunnel.
- Sydney traffic increased 3% to 1.077 million trips per day.
- M7 traffic rose 10.7% following the M7-M12 Integration Project.
- Melbourne traffic increased 4.2%, including approximately 37,000 daily West Gate Tunnel transactions.
- Brisbane average daily traffic increased 1.1%.
- North American average daily traffic increased 4.7%.
- Traffic on the 495 Express Lanes increased 17.3%.
- Average dynamic toll prices increased 20% on the 95 Express Lanes and 47.4% on the 495 Express Lanes.
- New road utilisation, traffic pricing and regional economic conditions will influence future cash generation.
Discover more from Business-News-Today.com
Subscribe to get the latest posts sent to your email.