



Conrad Industries, Inc. (OTCID: CNRD) ended June with US$292.8 million of contract backlog, equivalent to approximately 1.9 times its estimated US$155.1 million market capitalisation at the August 14 closing price. A simple addition of US$37.4 million of contracts signed after the quarter produces US$330.2 million of gross contracted visibility, slightly more than the company’s entire US$327.5 million of revenue in 2025, although that calculation is not an official updated backlog figure because work continued to be completed after June 30. The expansion came while second-quarter revenue fell 25% and net income declined 43.6%, creating a sharp divide between current production and future workload. The deeper finding is that the U.S. Navy’s Yard, Repair, Berthing and Messing barge programme represented 66.4% of June backlog, up from 48.8% six months earlier, meaning that one programme accounted for more than the company’s entire net backlog increase.
How did Conrad Industries build a US$292.8 million backlog while first-half revenue fell nearly 20%?
Conrad Industries generated second-quarter revenue of US$68.6 million, down from US$91.5 million a year earlier, as lower vessel-construction volume outweighed growth in repair and conversion work. First-half revenue fell 19.8% to US$138.0 million from US$172.0 million. Vessel-construction hours declined 26.7% in the second quarter and 25.6% across the first half, confirming that the revenue contraction primarily reflected lower production activity rather than an equivalent deterioration in contract margins.
Backlog moved in the opposite direction. It increased from US$213.9 million at December 31, 2025 to US$292.8 million at June 30, 2026, a net rise of approximately US$79.0 million, or 36.9%. Compared with the US$249.7 million reported one year earlier, backlog increased 17.3%.
One wording issue in Conrad Industries’ disclosure requires clarification. The results announcement and management discussion stated that backlog increased by US$196.4 million during the first half. That figure should not be interpreted as the change between the two period-end backlog balances because the balances show a net increase of only US$79.0 million.
The detailed backlog reconciliation provides the more precise accounting bridge. Conrad Industries started 2026 with US$213.9 million of backlog, recorded US$201.6 million of contract adjustments and new awards, and subtracted US$122.6 million of contract revenue earned. Those movements produced the US$292.8 million June balance. The separately disclosed US$196.4 million appears to represent gross additions under a narrower company definition, but the filing does not provide a specific reconciliation between that figure and the US$201.6 million reported as contract adjustments and new awards.
The distinction matters because gross contract additions and net backlog growth answer different questions. Gross additions measure new work secured and adjustments made to existing contracts. Net backlog growth reflects those additions after subtracting work already converted into revenue. The detailed reconciliation should therefore control any analysis of how the backlog balance actually changed.
Conrad Industries expects approximately 39.2% of the June backlog to be completed during the remainder of 2026. That percentage corresponds to about US$114.8 million of remaining performance obligations. It should not be treated as a complete second-half revenue forecast because repair work, newly signed contracts, project timing and percentage-of-completion accounting can also affect reported revenue.

Why does one U.S. Navy barge programme now account for two-thirds of Conrad Industries’ backlog?
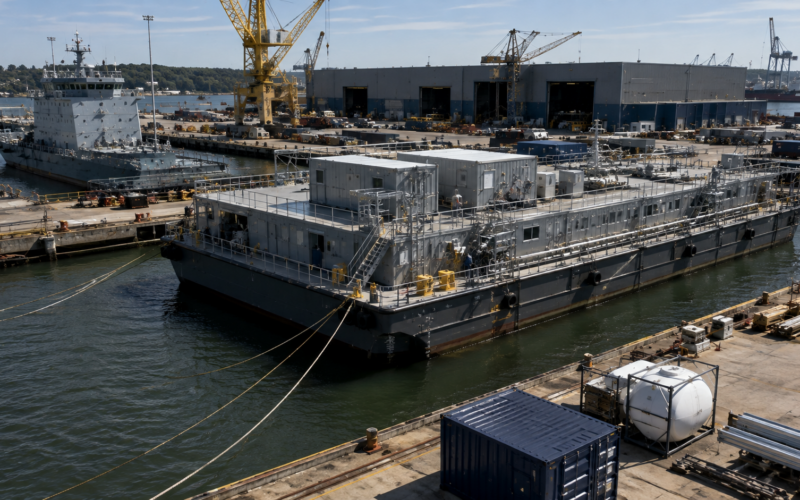
The largest driver is the U.S. Navy’s Yard, Repair, Berthing and Messing programme. These vessels provide temporary accommodation and working facilities for U.S. service members when naval vessels undergo repair or maintenance in port. Conrad Industries received the original fixed-price contract in 2022, and subsequent options and contract modifications expanded the programme to 15 barges.
The programme’s aggregate awarded value reached approximately US$359.9 million after a US$122.4 million contract modification for four additional barges in May 2026. Conrad Industries had delivered six barges through June. It expected another delivery during 2026 and anticipated delivering the eighth unit under the original contract during 2027, with the remaining barges scheduled for later delivery.
At June 30, the programme represented 66.4% of total backlog. Applying that percentage to the reported US$292.8 million balance produces approximately US$194.4 million of remaining Yard, Repair, Berthing and Messing work. At December 31, the programme represented 48.8% of the US$213.9 million backlog, equivalent to approximately US$104.4 million.
Based on those company-reported percentages, the programme backlog increased by approximately US$90.1 million during the first half. Backlog outside the programme declined from an estimated US$109.5 million to US$98.4 million. Because total backlog increased by approximately US$79.0 million, the Navy programme explains more than the entire net increase, while the remaining portfolio contracted by about US$11.1 million. These figures are approximate because Conrad Industries reported the programme percentages to one decimal place.
Customer concentration is also visible in recognised revenue. One unidentified customer accounted for US$34.8 million, or 25%, of first-half revenue, compared with US$22.2 million and 13% in the corresponding period of 2025. The filing does not identify that customer, so it would be unsafe to assume that it was the U.S. Navy or another specific government agency.
The programme concentration is neither automatically positive nor automatically negative. Government contracts can provide multi-year visibility and reduce dependence on cyclical commercial vessel demand. However, a fixed-price programme representing two-thirds of backlog also increases exposure to labour availability, steel costs, engineering revisions and project-specific execution.
The company added some diversification after quarter-end. Conrad Industries signed another US$37.4 million of contracts, including a US$24 million U.S. Army Corps of Engineers contract to design, build, test and deliver a deck barge for the Vicksburg District. The company is also working with Samsung Heavy Industries on a 12,000-cubic-metre liquefied natural gas bunkering articulated tug-barge design intended for construction in the United States.
The US$37.4 million can be added to June backlog only as a simple measure of gross contracted visibility. It should not be described as an updated US$330.2 million backlog because Conrad Industries did not provide a new backlog balance reflecting revenue recognised, project adjustments or other movements after June 30.
Does improved project execution compensate for the sharp fall in second-quarter revenue and earnings?
Second-quarter net income declined to US$3.3 million from US$5.8 million, while diluted earnings per share fell to US$0.65 from US$1.16. First-half net income decreased to US$6.5 million from US$9.7 million, with diluted earnings per share dropping to US$1.29 from US$1.93. The weaker results primarily reflected lower production volume and the pressure created by allocating overhead across fewer construction hours.
The underlying margin picture was more balanced than the net-income decline suggests. Second-quarter gross profit fell to US$6.6 million from US$8.0 million, but gross margin improved to approximately 9.6% from 8.8%. Vessel-construction gross margin increased to 9.2% from 8.5%, while repair and conversion gross profit rose 21.5%. These improvements indicate better execution across much of the active portfolio, even though lower volume prevented the margin progress from producing higher total profit.
Operating income declined 32.2% to US$4.0 million, a smaller contraction than the 43.6% fall in net income. The prior-year quarter benefited from higher other income, including a US$1.5 million recovery relating to a customer promissory note that had previously been deemed uncollectible. The 2026 quarter included a smaller US$418,200 grant from the U.S. Maritime Administration. The net-income comparison consequently reflects both weaker production and a less favourable contribution from non-operating items.
Selling, general and administrative expenses also increased 21.1% to US$2.6 million even though revenue declined. These expenses represented 3.7% of second-quarter revenue, up from 2.3% a year earlier, primarily because of higher advertising, professional fees and employee bonuses. Continued overhead growth could limit the benefit of stronger contract margins unless production volume recovers.
Execution risk remains material. Conrad Industries recorded US$2.5 million of charges during the first half for anticipated losses on certain incomplete vessels. Approximately US$8.6 million of previously recognised loss provisions remained associated with work in progress at June 30.
Management indicated that contracts signed during 2025 and the first half of 2026 generally reflected lessons learned from earlier projects, involved less complexity and were priced more accurately. That assessment is encouraging, but investors will need subsequent margin evidence before assuming the newer backlog will be more profitable than the work it replaces.
How much financial protection does Conrad Industries have against fixed-price contract risk?
The balance sheet provides meaningful protection. Conrad Industries finished June with US$47.6 million of cash and cash equivalents, up from US$27.5 million at the end of 2025. Total debt declined to US$625,000, leaving approximately US$47.0 million of net cash. Working capital increased to US$66.0 million from US$60.5 million.
Operating activities produced US$23.5 million of cash during the first half, compared with US$25.4 million a year earlier. After subtracting US$2.7 million of capital expenditure, operating cash after capital expenditure was approximately US$20.8 million under a simple BNT calculation. The figure should not be treated as a recurring run rate because movements in contract billings, inventories, receivables and other working-capital accounts materially affected first-half cash generation.
Based on the 5,017,935 outstanding shares reported by Conrad Industries, June cash was worth about US$9.49 per share. That represented nearly 31% of the US$30.90 August 14 closing price. The outstanding-share figure excludes the company’s treasury shares and therefore provides the appropriate base for the market-capitalisation calculation.
The company had no borrowings outstanding under its US$10 million revolving credit facility. A US$1 million letter of credit reduced available capacity to the lesser of US$9 million or 80% of eligible accounts at June 30.
The revolving facility’s maturity was extended to August 31, 2026, and Conrad Industries disclosed that it was discussing a further 24-month renewal with its lender. The approaching maturity deserves monitoring, but the absence of revolver borrowings and the company’s net-cash position reduce immediate refinancing pressure.
Performance bonds and letters of credit associated with normal contracting activity totalled US$123.7 million at June 30, down from US$172.5 million at December 31. These instruments are not equivalent to funded debt, but they demonstrate that expanding government and infrastructure work carries bonding requirements beyond the headline backlog figure. Conrad Industries also cautioned that it had previously encountered difficulty obtaining sufficient bonding capacity for larger projects on its preferred terms.
What does Conrad Industries’ valuation imply after the latest backlog expansion?
Conrad Industries closed at US$30.90 on August 14. Multiplying that price by the company-reported 5,017,935 outstanding shares produces an estimated market capitalisation of approximately US$155.1 million. Some market-data services may show different market values because of alternative share-count inputs, but the BNT calculation uses the outstanding shares disclosed by Conrad Industries for June 30.
The results were released at 6:45 p.m. Eastern Time, after the market had closed. The August 14 price therefore does not represent a regular trading-session response to the earnings announcement.
Before the release, the shares had increased approximately 6.2% across five trading sessions, 11.6% over one month, 17.7% during 2026 and 56.9% over 12 months. Trading volume was only 7,071 shares on August 14, which is an important qualification because Conrad Industries trades on the OTCID market and relatively small transactions can influence the quoted price. The stock closed about 7.3% below its reported 52-week high of US$33.33 and approximately 47.1% above its 52-week low of US$21.
The US$292.8 million June backlog was approximately 1.9 times the estimated market capitalisation. Subtracting US$47.6 million of cash and adding US$625,000 of debt produces a simplified enterprise value of roughly US$108.1 million before considering operating lease liabilities or other possible adjustments. On that simplified basis, backlog was approximately 2.7 times enterprise value.
Adding the US$37.4 million of post-quarter contracts to June backlog produces US$330.2 million of gross contracted visibility, equivalent to approximately 2.1 times the estimated market value. That figure remains an analytical calculation rather than a company-reported updated backlog.
These comparisons are useful measures of operating visibility, but backlog is future revenue rather than profit, cash or an asset that can be valued dollar for dollar. Fixed-price work can generate attractive margins, break-even outcomes or losses depending on labour, material costs and project execution. Investors should therefore avoid treating every dollar of backlog as equally valuable.
A trailing earnings calculation provides additional context. Starting with 2025 net income of US$19.9 million, subtracting the US$9.7 million earned in the first half of 2025 and adding the US$6.5 million earned in the first half of 2026 produces trailing net income of approximately US$16.7 million. Against the estimated US$155.1 million market value, the shares were trading at approximately 9.3 times trailing earnings under this BNT calculation.
The valuation does not appear demanding, but the discount partly reflects OTC liquidity, customer concentration, bonding requirements and the risks embedded in fixed-price marine construction. The market had also not received a full trading session in which to assess the latest earnings at the time of the calculation.
What are the key takeaways from Conrad Industries’ backlog growth and earnings decline?
- Conrad Industries’ period-end backlog increased by approximately US$79.0 million, or 36.9%, between December 2025 and June 2026, rather than by the US$196.4 million that could be inferred from the disclosure’s wording.
- The detailed reconciliation shows US$201.6 million of contract adjustments and new awards, offset by US$122.6 million of contract revenue earned during the first half.
- The U.S. Navy Yard, Repair, Berthing and Messing programme represented an estimated US$194.4 million, or 66.4%, of June backlog and accounted for more than the entire net backlog increase.
- One unidentified customer generated 25% of first-half revenue, adding another layer of concentration, although the filing does not identify that customer as the U.S. Navy.
- • Second-quarter revenue fell 25%, but gross margin improved by approximately 80 basis points as project execution and repair profitability partially offset lower production volume.
- Cash increased to US$47.6 million while debt fell to US$625,000, providing a substantial buffer against contract and working-capital volatility.
- The August 14 closing price predates the results announcement, so investor sentiment following the earnings and backlog disclosure remains untested in regular trading.
Can Conrad Industries convert a Navy-heavy order book into durable shareholder value?
Conrad Industries enters the second half with a stronger order book, a net-cash balance sheet and evidence that gross margins can improve even when production volume declines. The combination of US$292.8 million in June backlog and US$37.4 million of subsequent contracts provides substantial work visibility if projects advance according to schedule.
The investment case is not simply that backlog exceeds market value. The decisive question is whether the company can convert a government-heavy, fixed-price portfolio into revenue without recreating the forward losses recorded on earlier complex vessels. Improved gross margins, lower remaining loss provisions and management’s assessment that newer contracts are less complex and more accurately priced are constructive indicators, but they are not yet proof of consistently stronger profitability.
Pre-release market sentiment was positive based on the stock’s gains over the previous month and year, although limited OTC liquidity makes the share price less reliable as an immediate institutional signal. The next confirmation should come from rising construction hours, stronger revenue conversion and preservation of the improved gross margin. If those indicators develop together, the current valuation could leave room for further upside. If backlog rises while production remains weak or additional loss provisions emerge, the apparent discount may prove justified.
Discover more from Business-News-Today.com
Subscribe to get the latest posts sent to your email.