


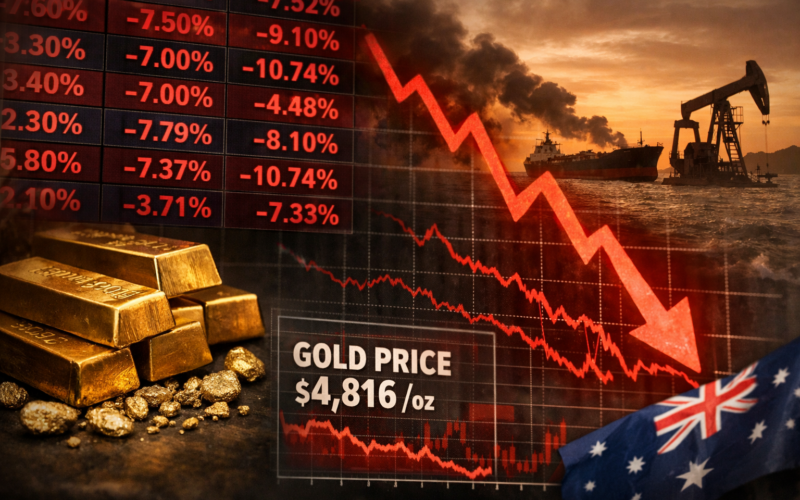
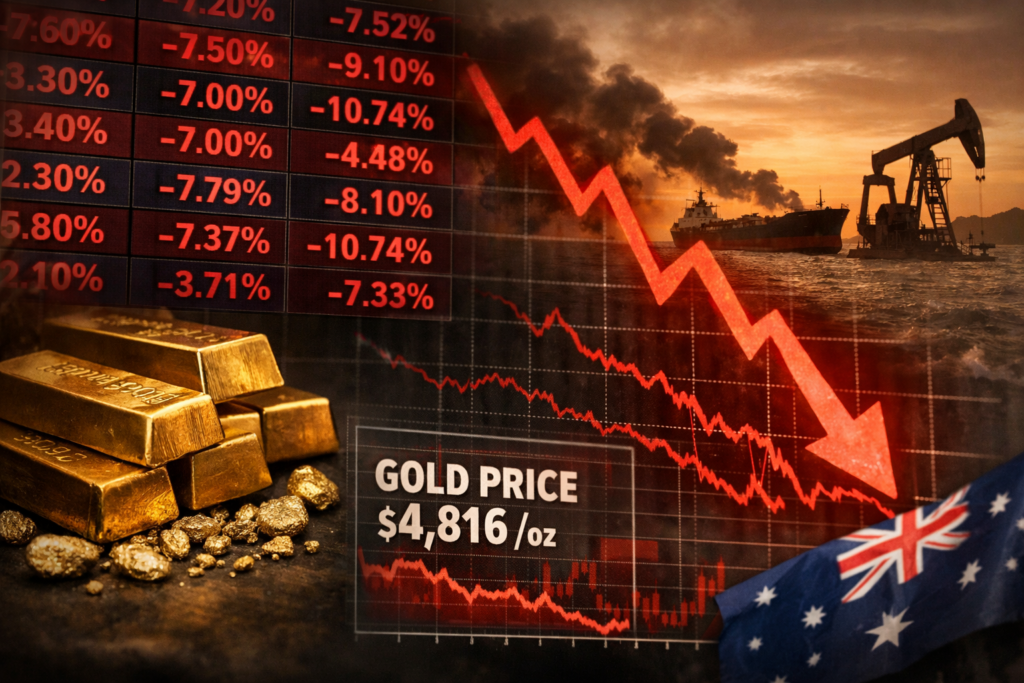
Australian Securities Exchange (ASX)-listed gold equities suffered one of their sharpest single-session selloffs of 2026 on Thursday, with the sector broadly losing between 5% and 11% in early trading as the spot gold price declined 3.73% to US$4,816 per ounce overnight, its lowest level since 6 February. The immediate trigger was the Federal Reserve’s decision on 18 March to hold its benchmark funds rate steady in the 3.5% to 3.75% range while signalling a cautious, higher-for-longer stance driven by oil-fuelled inflation linked to the ongoing Iran conflict and its disruption to Strait of Hormuz shipping. For ASX gold miners already contending with company-specific operational setbacks, the macro repricing arrived at the worst possible moment, compressing valuations across producers of every scale simultaneously. Among the heaviest individual casualties, United States-headquartered Newmont Corporation (ASX: NEM), the world’s largest gold miner with a secondary ASX listing, fell 5.09% to A$147.32, Northern Star Resources (ASX: NST) dropped 7.92% to A$19.29, and Ora Banda Mining (ASX: OBM) led the declines at 10.74% to A$1.33.
Why did the Federal Reserve hold rates in March 2026 and what does that mean for gold prices and mining stocks?
The Federal Open Market Committee voted to leave rates unchanged at its 18 March meeting, the second consecutive hold in 2026, with at least two members dissenting in favour of a quarter-point cut. The hold followed three quarter-point reductions across the September, October, and December 2025 meetings that brought the funds rate to its current 3.5% to 3.75% range. The decision to pause again was widely anticipated, but the updated Summary of Economic Projections delivered a message markets found harder to absorb: the Fed now projects personal consumption expenditure inflation running at 2.7% for 2026, above its 2% target, with growth still pencilled in at a solid 2.4%. The dot plot pointed to just one further cut in 2026 and another in 2027 before the funds rate stabilises around 3.1% on a long-term basis, with seven of nineteen committee members signalling no cuts at all this year.
The policy backdrop has been significantly complicated by the Iran conflict and the disruption to Gulf oil flows through the Strait of Hormuz. Brent crude was trading above US$104 per barrel and West Texas Intermediate above US$97 heading into the announcement, with energy prices feeding directly into inflation expectations and narrowing the Fed’s room to manoeuvre on the dovish side. In its post-meeting statement, the committee added new language acknowledging that the implications of Middle Eastern developments for the United States economy are uncertain, and that it will remain attentive to risks on both sides of its dual mandate. Powell added at his press conference that near-term energy price rises will push overall inflation higher, but it is too soon to know the scope and duration of the effects on the broader economy. The immediate market reaction was a modest retreat in United States equities, a slight tick up in the dollar, and a continuation of gold’s ongoing correction from the highs above US$5,400 recorded in late January.
For gold, the transmission mechanism from hawkish Fed signalling to spot price pressure is well established. Fewer expected rate cuts reduce the opportunity cost of holding yield-free bullion, while a firmer dollar squeezes positions denominated in other currencies. The paradox of 2026’s gold market is that the very geopolitical event driving oil higher and complicating Fed policy, the Iran conflict, also triggered some of gold’s sharpest single-session declines as leveraged paper traders flush positions when margin pressure mounts. The physical market has told a different story, with premiums remaining elevated and central bank buying continuing at pace, but that structural demand support has not been enough to prevent violent short-term corrections in futures pricing.
How are ASX gold producers exposed to the gold price correction and what scale of losses did investors face on 19 March 2026?
The breadth of the selloff across ASX gold equities was notable even by the standards of a sector accustomed to amplified swings relative to the underlying commodity. The gold price moved 3.73% lower overnight, yet the majority of ASX-listed producers fell between two and nearly three times that magnitude, reflecting the inherent leverage of mining economics: when revenue per ounce declines but fixed and semi-fixed costs remain constant, margins compress at a faster rate than the commodity price drop. That amplification is most severe for higher-cost operations and for producers already dealing with operational setbacks that have raised their effective cost bases.
Among the larger producers, Evolution Mining (ASX: EVN) fell 6.81% to A$12.58 and Perseus Mining (ASX: PRU) declined 6.95% to A$4.82. Mid-cap names bore heavier losses: Ramelius Resources (ASX: RMS) was down 8.54% to A$3.70, Westgold Resources (ASX: WGX) fell 8.35% to A$5.66, and Vault Minerals (ASX: VAU) declined 8.77% to A$4.22. Genesis Minerals (ASX: GMD) dropped 9.40% to A$5.59, Regis Resources (ASX: RRL) lost 9.43% to A$6.39, and Alkane Resources (ASX: ALK) fell 10.09% to A$1.45. The smaller end of the market absorbed some of the sharpest blows, with Meeka Metals (ASX: MEK), Emerald Resources (ASX: EMR), and Black Cat Syndicate (ASX: BC8) all falling between 7.65% and 8.88%.
St. Barbara (ASX: SBM), already burdened by an extended period of operational and financial restructuring, fell 7.17% to A$0.56. Capricorn Metals (ASX: CMM), one of the sector’s stronger cost performers in recent years, dropped 9.00% to A$10.52. Bellevue Gold (ASX: BGL), which has faced its own ramp-up challenges at its namesake underground operation in Western Australia, fell 9.03% to A$1.46. Pantoro Gold (ASX: PNR), whose shares have fallen approximately 32% from the start of 2026 following a production downgrade at its Norseman project, shed a further 7.71% to A$3.59. The cumulative context for many of these names is that macro headwinds now sit on top of pre-existing company-level pressures, making the recovery path correspondingly more complex.
What does Northern Star Resources’ production downgrade mean for the broader outlook of Australia’s largest gold miner and its ASX 20 inclusion?
Northern Star Resources (ASX: NST), Australia’s largest gold producer, has had a particularly bruising run in the weeks leading up to the sector-wide selloff on 19 March. After touching an all-time high of A$31.96 in early March, the stock has since declined sharply, sitting at A$19.29 in Thursday’s session, a fall of approximately 40% from that peak and placing the shares at their lowest level of 2026. This deterioration reflects the damage done by a second guidance downgrade in ten weeks, which stripped approximately A$6 billion in market capitalisation in a single session on 13 March alone.
Northern Star now expects full-year fiscal 2026 production to come in above 1.5 million ounces, a phrase the market has interpreted as a soft floor of approximately 1.5 to 1.6 million ounces. That compares to the 1.6 to 1.7 million ounce range the company was reaffirming as recently as January, and the original plan of 1.7 to 1.85 million ounces. Total gold sales for January and February 2026 came to only 220,000 ounces, a run rate that implies very significant H2 improvement will be needed even to reach the lowered target. The primary contributors to underperformance have been milling failures at the Kalgoorlie KCGM operation, which processes ore from the legendary Super Pit, and reduced mining productivity at the Jundee operation in Western Australia.
The A$1.5 billion expansion of the KCGM processing plant remains on schedule for commissioning between July 2026 and June 2027, with approximately 800 contractors currently working on the plant and a further 400 on enabling works. Management has been transparent about the trade-off: protecting the expansion timeline has taken priority over short-term production optimisation, accepting higher near-term costs in exchange for what should be a structurally stronger operation once the new mill is online. The company’s inclusion in the S&P/ASX 20 index on 23 March will bring mechanical buying from index funds, but market participants will require evidence of operational execution before awarding Northern Star a premium multiple again. The second downgrade in two months has inflicted credibility damage that a recovery in gold prices alone cannot repair.
Is the March 2026 gold price correction a structural reversal or a temporary pullback driven by paper market positioning and the Iran oil shock?
The structural case for gold has not materially weakened. Institutional price targets remain well above current levels: J.P. Morgan holds a 2026 year-end target of US$6,300 per ounce, Deutsche Bank has set US$6,000, and Goldman Sachs maintains a figure above US$6,000. These projections were set before the Iran conflict escalated and, if anything, the geopolitical backdrop has only added to the long-term argument for an asset that holds no counterparty risk and cannot be forced to liquidate. The World Gold Council reported record global ETF inflows of US$18.7 billion in January 2026, led by North American and Asian buyers, and central bank purchases remained at 230 tonnes in Q4 2025, continuing a period of sustained official sector accumulation even as prices hit successive highs.
The immediate selloff mechanism reflects dynamics specific to paper markets rather than a fundamental reassessment of gold’s investment case. Gold initially spiked from US$5,296 to US$5,423 on Hormuz closure news before reversing sharply, a move consistent with leveraged traders flushing positions as margin calls cascaded through the market. Physical gold premiums stayed elevated during the same session. The paradox is a defining feature of 2026’s gold market: the macro transmission from oil shock to inflation expectations to reduced rate cut expectations to dollar strength to gold liquidations can override safe-haven demand even in an active military conflict, at least in the short term. The US$5,000 per ounce level is the technical floor most analysts are watching; as long as gold holds above that threshold, the current correction sits inside a bull market rather than signalling the end of one.
For ASX gold producers, the operative question is the floor level at which gold prices comfortably sustain margins across the cost spectrum of the sector. At US$4,816 per ounce, most producers remain profitable, though with materially tighter margins than at the highs above US$5,400. Higher-cost operations and those dealing with operational disruptions face a more acute squeeze. The RBA’s rate environment adds a layer of complexity specific to Australian producers: after a recent cash rate increase, the Australian dollar is facing its own pressures, and the AUD/USD exchange rate movement can partially cushion or amplify the impact of USD gold price moves on Australian dollar revenues.
What does the Iran conflict and its impact on global oil markets mean for the Federal Reserve’s ability to cut rates and support gold in 2026?
The Iran conflict’s disruption to Strait of Hormuz oil flows represents a classic adverse supply shock: it pushes energy prices higher, feeds into headline and potentially core inflation, and creates a dilemma for central banks trying to balance growth support with price stability. The Fed’s response has been to hold and observe, declining to pre-commit to either additional cuts or outright tightening. Federal Reserve Chair Jerome Powell has noted that while the conflict’s economic implications are uncertain, the committee sees it as a risk to both its inflation and its employment mandates, reflecting the stagflationary character of an oil price shock that hits both supply costs and consumer spending power simultaneously.
Markets had previously priced in two rate cuts for 2026. The FOMC’s March projections reduced that median expectation to one, and seven of nineteen officials now project no cuts at all. Each upward revision to the rate path strengthens the dollar, reduces the attractiveness of non-yielding assets, and puts incremental pressure on gold prices in futures markets. The PCE inflation report, the Fed’s preferred measure, has been rescheduled from its original 27 March release to 9 April, reducing the amount of inflation data available to policymakers and markets ahead of the April FOMC meeting. That data vacuum creates additional uncertainty and keeps investors on the defensive.
The longer-term picture for gold remains constructive if the Fed eventually does resume cutting rates, a scenario most major investment banks still consider the base case for 2026 or 2027. Central bank buying continues to provide a structural floor. ETF demand has been robust. And the fiscal and geopolitical conditions that drove gold from approximately US$2,600 per ounce to above US$5,000 in roughly twelve months have not disappeared. The near-term question is how deep and how extended the current correction runs before buyers return at scale, and whether ASX gold equity investors are prepared to absorb further pain in the interim or move to reduce exposure to a sector already burdened by operational challenges at its largest names.
Key takeaways: What the ASX gold selloff of 19 March 2026 means for miners, investors, and the broader gold market outlook
- The Federal Reserve’s hawkish hold on 18 March, projecting just one rate cut in 2026 amid Iran conflict-driven inflation, was the immediate macro trigger for gold’s 3.73% overnight decline to US$4,816 per ounce, the lowest since early February.
- ASX gold equities amplified the commodity move significantly, with declines ranging from 5% to nearly 11% across the sector, reflecting the leveraged relationship between gold prices and mining margins when cost bases remain largely fixed.
- Northern Star Resources (ASX: NST), Australia’s largest gold producer, enters Thursday’s broader sector selloff already down approximately 40% from its early March all-time high of A$31.96 following a second guidance downgrade in ten weeks that erased roughly A$6 billion in market value on 13 March alone.
- The Iran conflict creates a paradox for gold: the same geopolitical shock that provides a fundamental long-term case for safe-haven assets is, through its oil price and inflation transmission, actively reducing near-term Fed rate cut expectations and strengthening the dollar, the two most immediate headwinds for spot gold.
- Structural institutional demand for gold remains intact, with J.P. Morgan, Deutsche Bank, and Goldman Sachs maintaining 2026 year-end targets in the US$6,000 to US$6,300 range, and central banks still purchasing at elevated rates.
- The US$5,000 per ounce level represents the key technical and psychological support for gold in current market conditions; a sustained close below that threshold would represent a more serious signal of correction depth.
- Higher-cost ASX producers and those already managing company-specific operational disruptions face the sharpest margin compression in the current environment, with names like St. Barbara (ASX: SBM), Bellevue Gold (ASX: BGL), and Pantoro Gold (ASX: PNR) carrying pre-existing structural vulnerabilities into the macro headwind.
- The RBA’s independent rate trajectory and AUD/USD dynamics introduce an additional variable for Australian gold investors that can partially offset or compound USD gold price moves depending on currency direction.
- ASX 20 index inclusion for Northern Star Resources on 23 March will bring passive mechanical buying, but market confidence in management’s operational execution will need to be rebuilt before the stock commands a valuation consistent with its resource base.
- The investment case for Australian gold equities over the medium term hinges on whether the Fed resumes cutting rates as growth slows and oil inflation proves transitory, a sequence that most major institutions still project but which could take several quarters to materialise.
Discover more from Business-News-Today.com
Subscribe to get the latest posts sent to your email.